Introduction
With the Dash application of Plotly team it is very easy to create custom Flask app/frameworks to deploy locally or on a dedicated server.
Meteo-App SouthTyrol
The Bolzano County provides historical data and dedicated API to download them.
The data start from 2014 and depending on the station, different variables are available (rain, temperature, wind speed, etc).
See the official webpage for further information.
Set-up
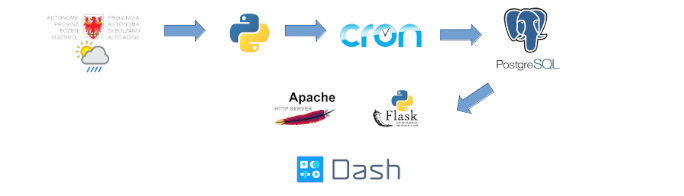
We wrote a simple python script that harvests the data from the original database and writes them into a dedicated PostgreSQL database on our personal server.
This script is executed every day (actually every night) with a cronjob on our Liux Server.
The data are now available to be processed with SQL queries and other statistical tools.
Dash
There are many different frameworks that can be used to display the data. One of these is Dash, build on top of Flask.
Thanks to Dash, the data are read from the DB and different plots are available in order to see the behavior of many variables and places.
It is also possible create many plots on the same canvas in order to compare the same variable in different places.
Some example:
-
Comparing the temperature in Bolzano - Brunico - Merano:
-
Rain in Bolzano:
-
Wind speed in Merano:
Deploy applicazione
Dash and Flask can be deployed on your server. There are many ways to do it, one of this is by using the we server Apache.
For forther information have a look at the meteoapp repository or write us an email info@faunalia.eu.