DataPlotly 3.0
Thanks to all the contributors of the past crowdfunding campaign we, Faunalia and North Road, are finally ready to release DataPlotly 3.0.
We have implemented all the features of the campaign, let's explore them.
Feature subset in plot canvas
Now it is possible to choose just a small subset of feature to display in the main plot canvas. DataPlotly provides 3 main options:
- only selected features
- only features visible on the map
- filter with a custom expression the source layer

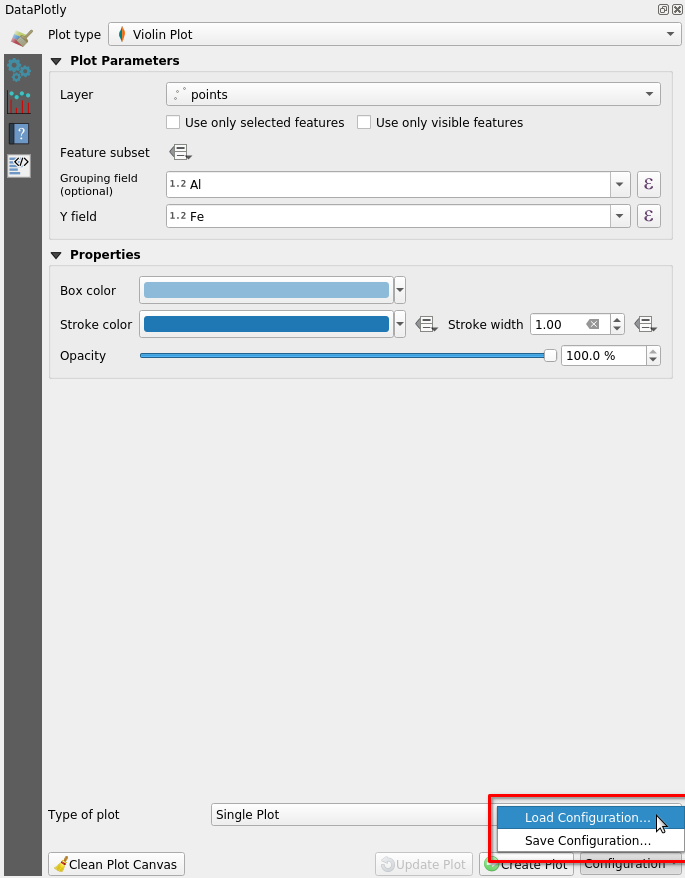
Saving plot settings
The plot settings are now saved in the project and reloaded automatically when the project is re-opened.
Alternatively you can export a configuration file (as xml) and reload it
whenever you want:
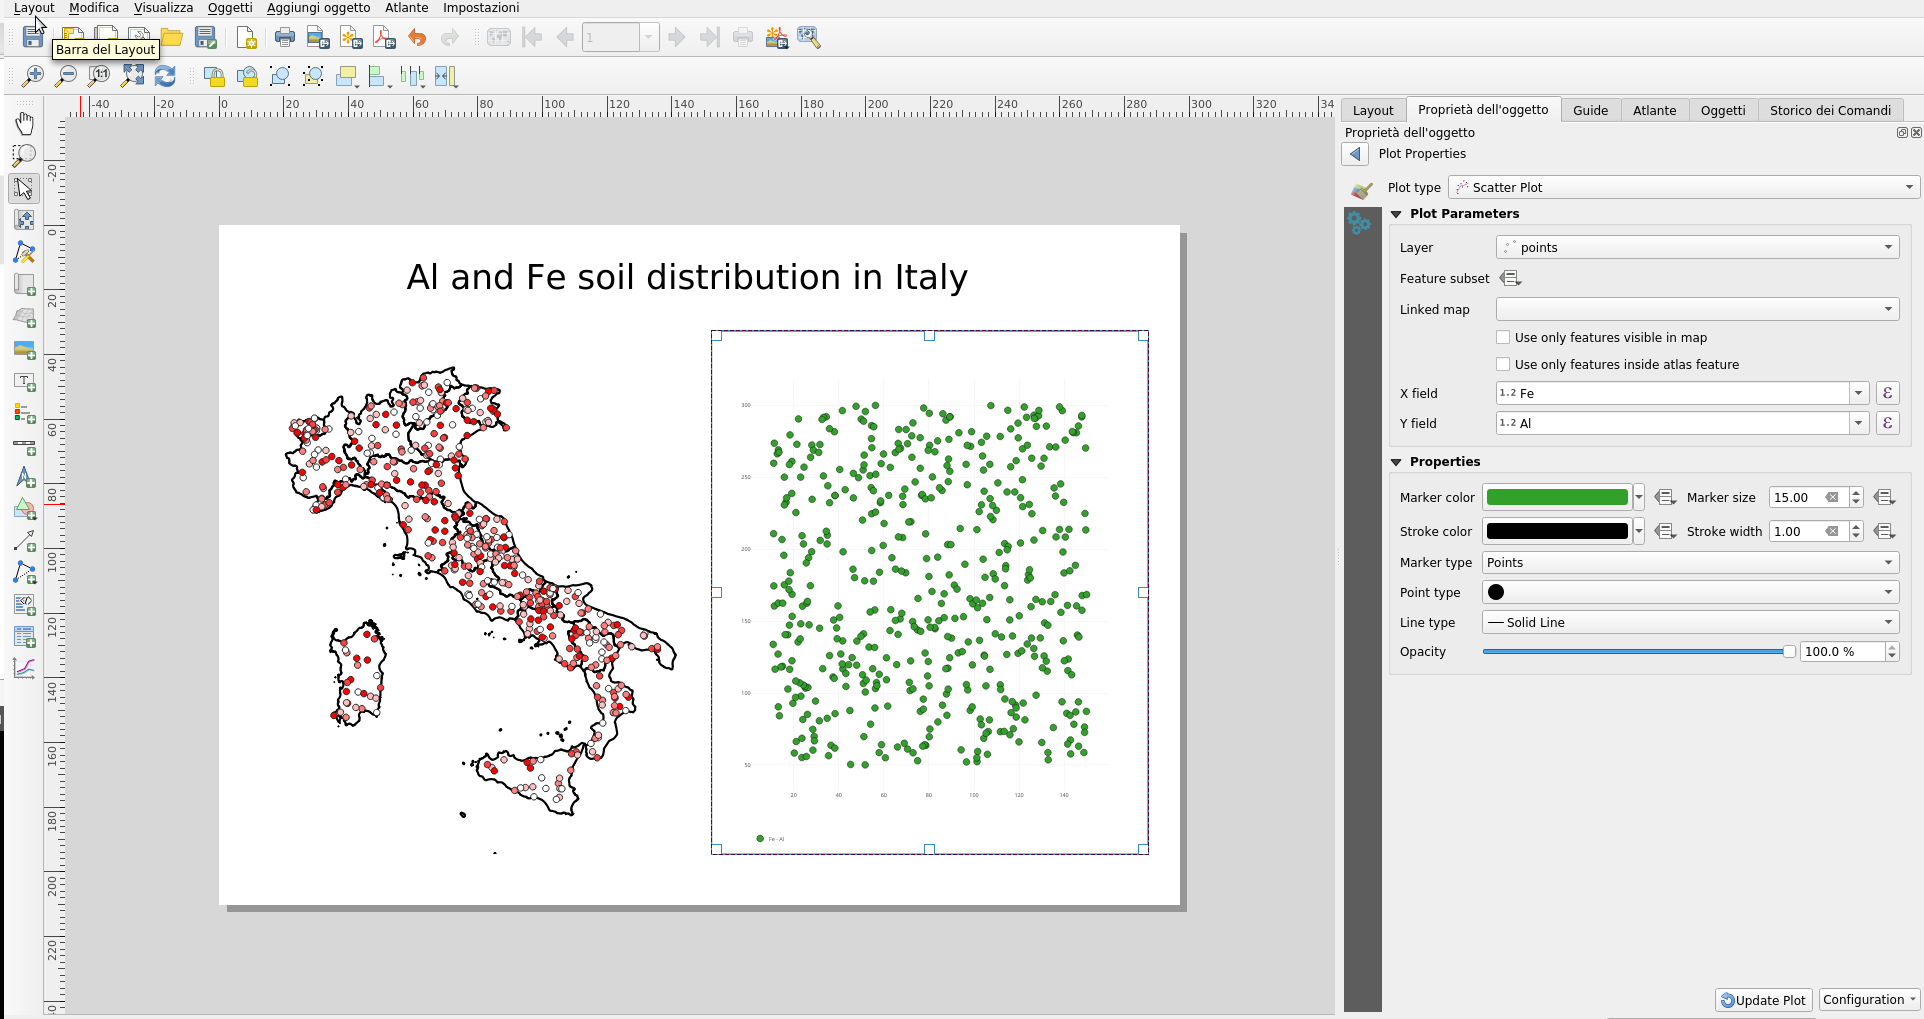
Plots in the layout composer
DataPlotly is now usable within the print composer of QGIS! You can add as many plots as you want with the same UI:
The awesome news is that you can set DataPlotly to follow the coverage layer set up in the atlas properties:
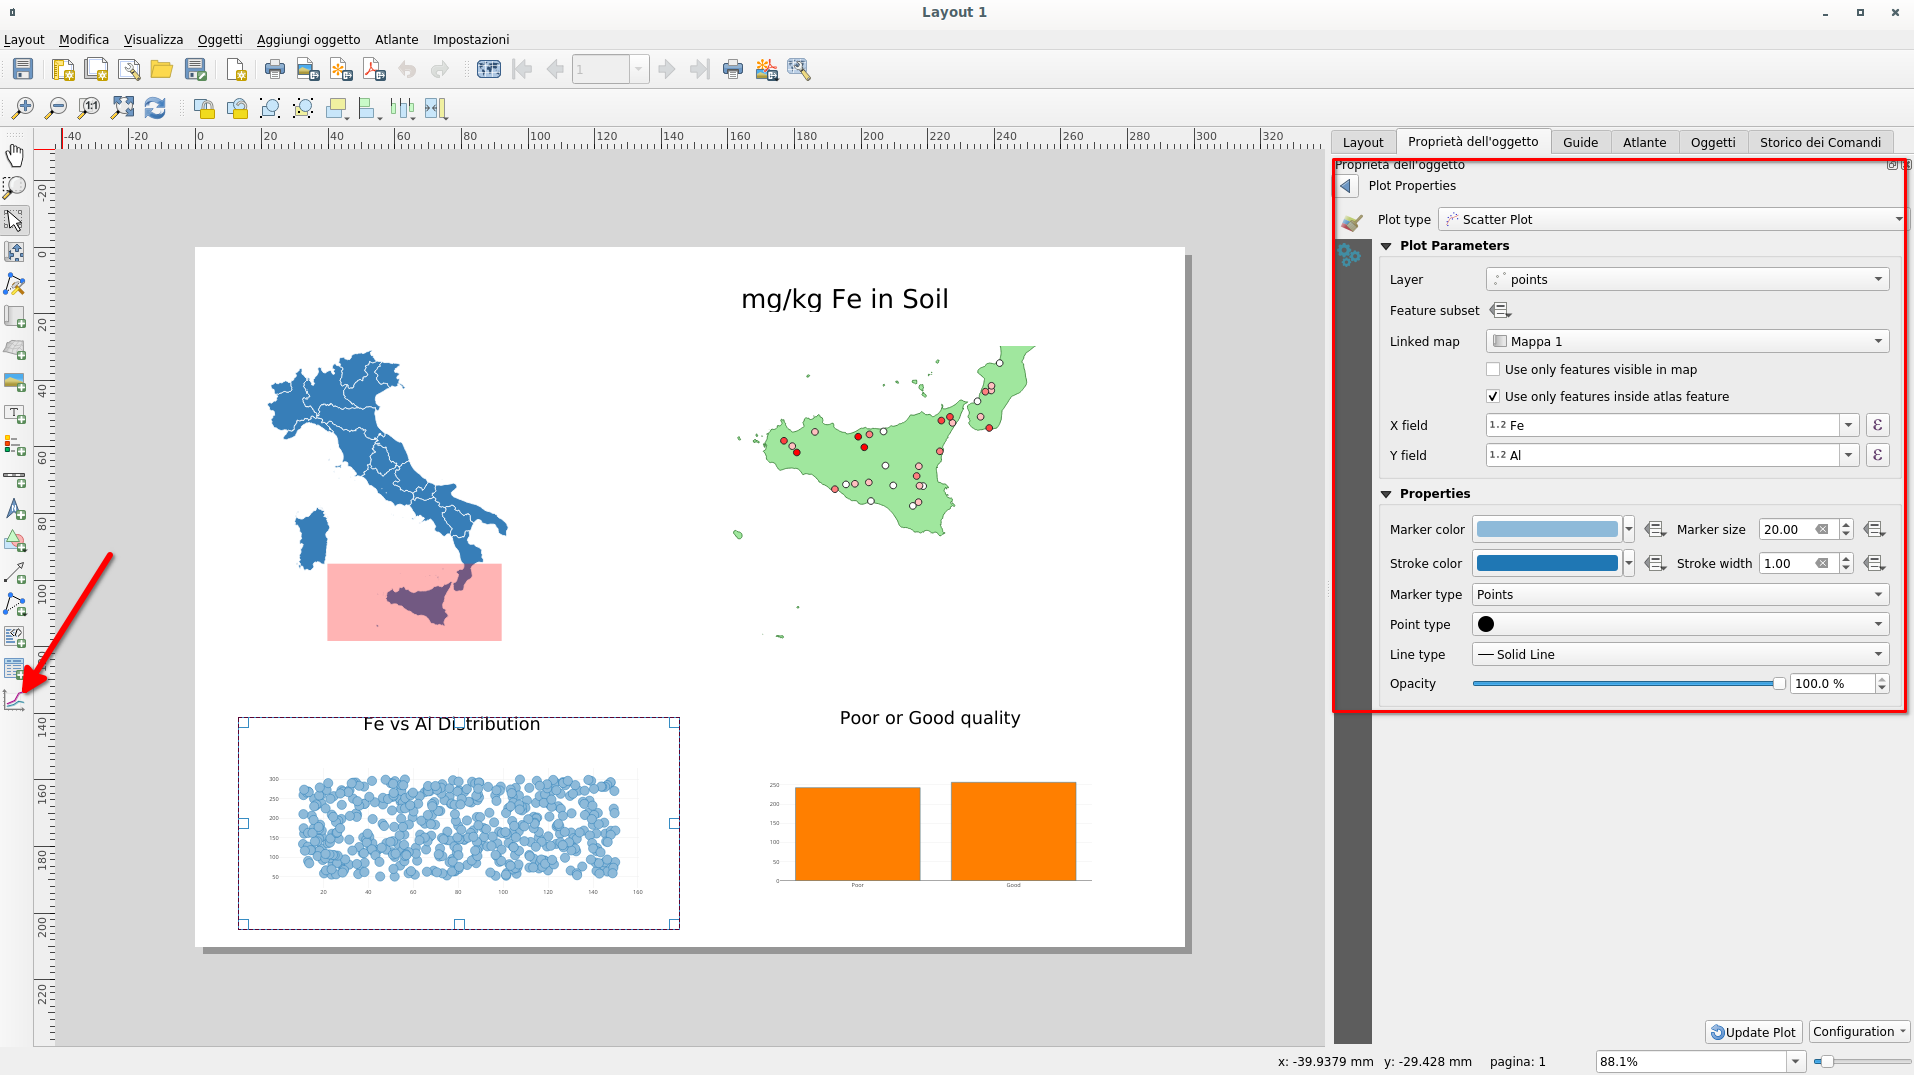
Download the latest version and create some layout: share the results with the hashtag #DataPlotly!
Thanks to all the people:
- Federico Gianoli
- Papercraft Mountains
- Liam McCrae
- Henry Walshaw
- Raúl Sangonzalo
- Ferdinando Urbano
- pitsch-ing.ch
- Carbon-X
- Gabriel Diosan
- Rene Giovanni Borella
- Enrico Bertonati
- Guido Ingwer
- David Addy
- Gerd Jünger
- Andreas Neumann
- Stefano Campus
- Michael Jabot
- Korto
- Enrico Ferreguti
- Carlo A. Nicolini
- Salvatore Fiandaca
- Alberto Grava
- Hans van der Kwast
- Ben Hur Pintor
- Silvio Grosso
- Nobusuke Iwasaki
- Alasdair Rae
- Manori Senanayake
- Canton de Neuchâtel
- Matthias Daues
- Alteri Seculo
- SunGIS Ltd.
- Stu Smith
- Keolis Rennes
- Gabriel Diosan
- Aiden Price
- Giacomo Ponticelli
- Diane Fritz
- Gemio Bissolati
- Claire Birnie
- Nicolas Roelandt
- Rocco Pispico
- Gabriel Bengtsson
- Birds Eye View
- Barend Köbben
- Roberto Marzocchi (GTER)
- Yoichi Kayama
- Alessandro Sarretta
- Luca Angeli
- Luca Bellani
- giswelt
- Stefan Giese
- Ben Harding
- Joao Gaspar
- Romain Lacroix
- Ryan Cooper
- Daniele Bonaposta
- QGIS Swedish User Group
- Nino Formica
- Michael Gieding
- Amedeo Fadini
- Andrew Hannell
- Stefano
- Phil Wyatt
- Brett Edmond Carlock
- Transitec